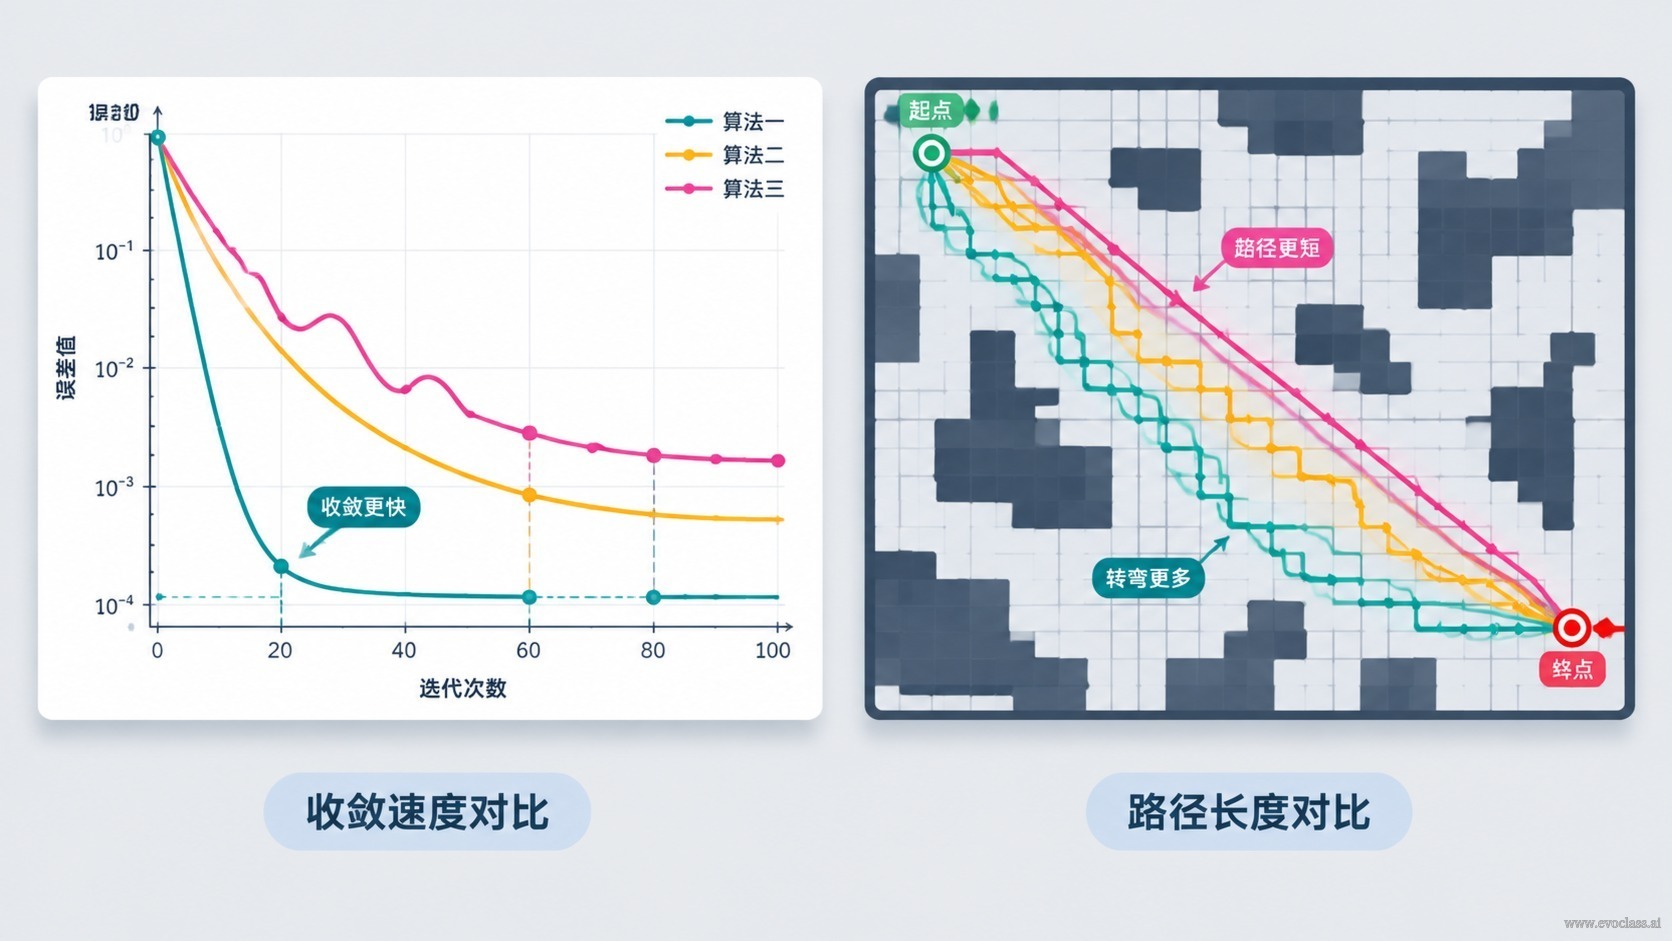
In the EvoX multi-objective warehouse robot pathfinding experiment,“getting one nice-looking solution” does not mean the optimization has genuinely made progress. To judge whether a single run is trustworthy, you must obtain two kinds of evidence at the same time: one describes thesearch process(the convergence curves of each objective over generations), and the other describes thefinal solution(the route visualization and metric table under a fixed warehouse layout). The curves only answer “is the search moving at all,” while the route and metrics answer “is the result usable.”
1. Read the Convergence Curves First: What Is Happening in the Search Process
Plot each objective value as a curve against generation; what you observe is thetrend, not the value at any single point. Four common patterns in engineering need to be clearly distinguished:
- Continuous improvement: The curve steadily decreases in the early-to-mid stage (or the overall indicator steadily rises), indicating that the population is still searching effectively and that crossover and mutation continue to produce better candidate solutions.
- Oscillation: The curve fluctuates up and down without a clear long-term direction, usually caused by evaluation noise, constraint conflicts, or excessive diversity; check the evaluation function and parameter settings.
- Stagnation: The curve is nearly flat over a certain interval, but it may still improve again in later generations — this is a “temporary loss of improvement direction.”
- Premature convergence: The curve flattens completely at an early stage and never recovers; this is usually due to loss of population diversity or premature compression of the solution space.
2. Next, Look at the Final Route Under the Fixed Warehouse Layout
Overlay the evolved optimal route and the comparison route onthe same fixed warehouse map, and check three things: whether the path is truly reachable, whether obstacle avoidance is reasonable, and whether the final segment near the goal is stable. A fixed layout is a key constraint — only when the environment is unchanged can route differences between different runs or different parameters be attributed to the optimization itself rather than to a changed map.
3. Support Conclusions with Complete Experimental Data
A conclusion only counts if it is reproducible. Please save and verify: the run configuration and random seed, the iteration log, the objective values by generation, the final route, and the evaluation results. When necessary, confirm whether the same conclusion holds consistently through re-runs or cross-checks. If the curve no longer improves markedly in the later stage, use the complete log to determine whether this is premature convergence, evaluation saturation, or simply being close to a usable solution; do not draw conclusions from a single screenshot.
Interpreting Convergence Curves and Pathfinding ResultsThe figure interprets the search process together with the final solution: the convergence curves reflect each objective's trend over iterations, and you need to distinguish continuous improvement, oscillation, stagnation, and premature convergence; the route map and metric table under the fixed warehouse layout answer whether the result can be used. Only when the process trend and the final route corroborate each other can you rule out misinterpretation caused by a single good-looking result.